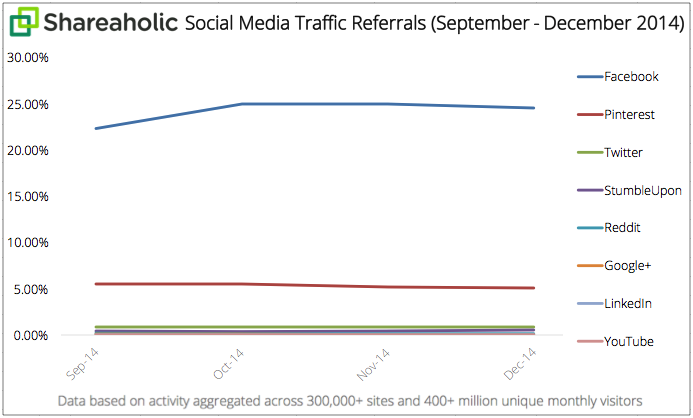
Here’s a very interesting social media report from Shareaholic. According to the report, the top 8 social networks (Facebook, Pinterest, Twitter, StumbleUpon, Reddit, Google+, LinkedIn, and YouTube ) drove 31.24% of overall traffic to websites.
Their latest report, is broken up into three main parts:
Section I: Social referrals over Q4 2014 (September – December 2014) – A brief look at 4 months of data collected from 300,000+ websites reaching a global audience of more than 400 million unique monthly visitors.
Section II: Social referrals Year-Over-Year for 2014 (December 2013-2014) – A review of 13 months of data collected from 300,000+ websites reaching a global audience of more than 400 million unique monthly visitors.
Section III: Social referrals over 3 years to understand greater historical trends (December 2011-2014) – An in-depth analysis of 37 months of data collected from 150,000+ websites reaching a global audience of more than 200 million unique monthly visitors.
What’s interesting is Facebook traffic gained 24.63% out of the 31.24% . This is something marketers should consider in building their social media marketing campaign. See chart below: Read for further social media traffic trends here:
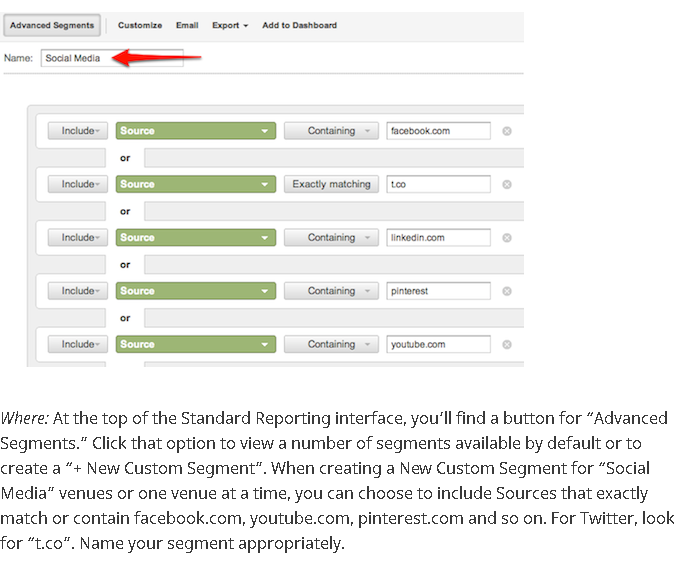
Convince and Convert teaches us how we can group our social media traffic and how to maximize Google Analytics reporting for a better understanding of social referral traffic. Read more here:
Takeaway: Based upon the reports above, we suggest that you go to Google Analytics and analyze your social media traffic from 2o13 and 2014 .
1. Track down which social network drove the highest amount of traffic.
2. Note your social media connections in each social network
3. Consider your time spent on each
4. How frequent you posted on each network
5. Types of contents they consume on each social network
These factors will somehow give you insights into your social referral traffic and help segment your future social media campaigns.


