
Infographics break down data visually, helping viewers make sense of complex information. Their popularity has increased with the rise of social media, fuelling the need for instant results by providing content in bite-size, digestible chunks.
Here’s an Infographic showing the effectiveness of incorporating infographics into your content.
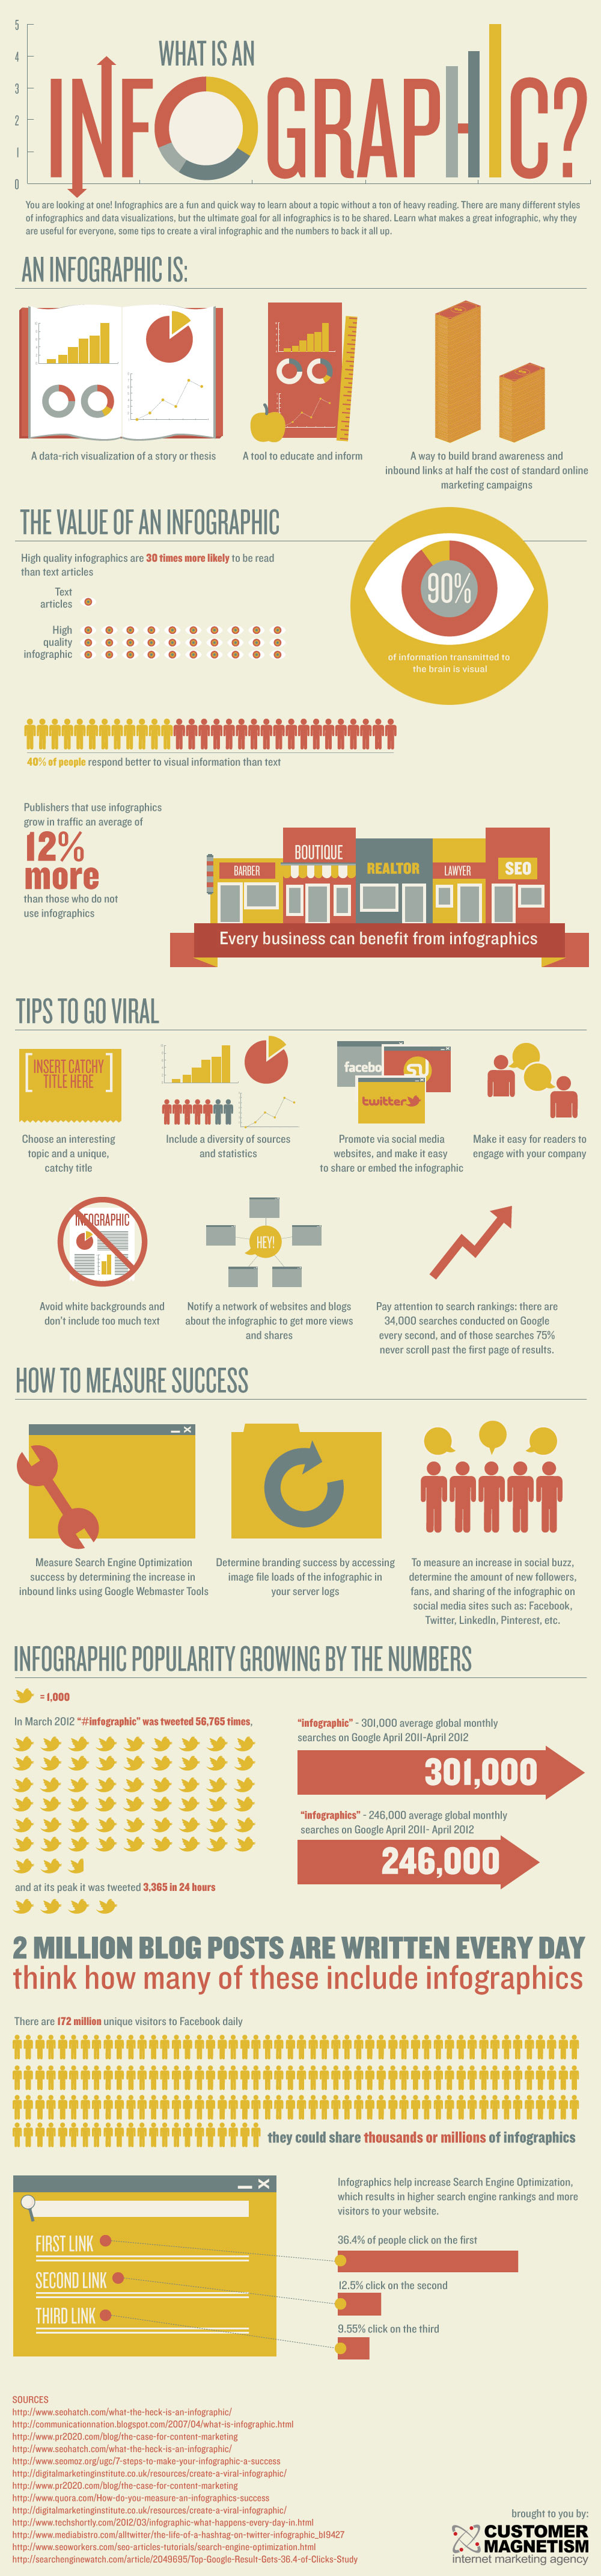
Created by Customer Magnetism.
More Reasons to Use Infographics
- Builds links – with 60% of people being visual learners, infographics are a great way of capturing the attention of web users, and it’s also a great way of encouraging people to share and credit back to you. People will link back to your website when they feature your infographic and not only will your site benefit from the relevant link, but also the traffic.
- Can be shared – infographics are easily digested, simple to understand and interesting to look at. They can also be shared easily through social sites such as Facebook, Twitter, Digg, Reddit, StumbleUpon and more.
- Branding opportunity – people just love infographics! Create a superb infographic and it could go viral. You could add your company logo to a prime position on the graphic without it being too obtrusive, and get a boost in your online presence and your online branding.
So infographics are scalable, shareable and brandable, and can add value to your SEO campaign. If you want to dress up your blog , create a stylish and informative infographic for everyone to feast their eyes on! (Source)
So? You need Infographics? Worry no more. We researched and handpicked awesome sites where you can get plenty of infographics. See below!
- Nowsourcing is a full service infographic agency specializing in infographic research, design, and promotion as well as video and interactive infographics. Visit their blog here.
- Cool Infographics highlights some of the best examples of data visualizations and infographics found in magazines, newspapers and on the Internet.
- Daily Infographic features the best information design and data visualization from the internet on a daily basis.
- Visual.ly is the world’s largest community of infographics and data visualization. Join others. Find and make your own infographics.
- Piktochart a quick and easy way for non-designers to create and share infographics. They have free and premium package.
Add color to your content. It’s time for you to create one now! Hope you find this helpful. Don’t forget to leave your comments 🙂
Trackbacks/Pingbacks